Use Analytics to see how many people visited your published shop, how far they got and where they came from. The examples follow Saltbush Ceramics.
Start Collection
Collection is off by default, so a new shop's Analytics page explains that there is nothing to show yet and links to Site Design. The badge at the top reads Collection off.
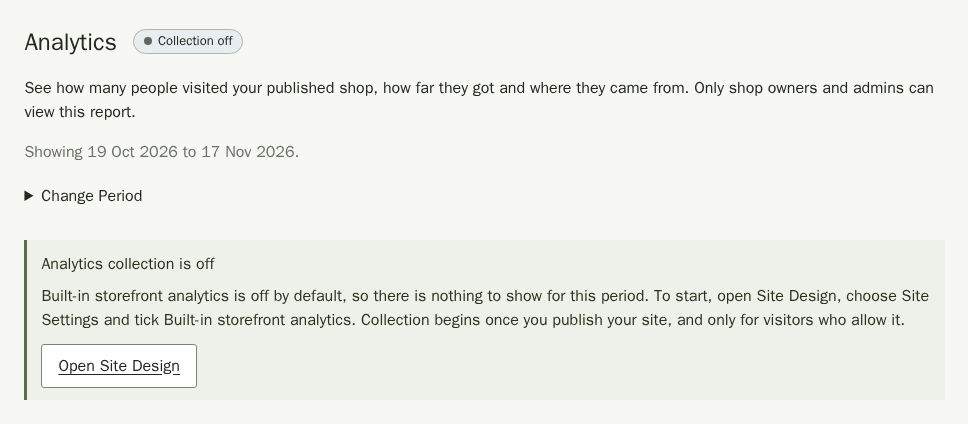
- Choose Open Site Design, then open Site Settings.
- Choose Search Engines and Analytics under Jump to.
- Tick Built-in storefront analytics under Built-In Analytics.
- Choose Save Changes, then Publish Site.
Until the first visitor allows analytics, the page shows Waiting for the first visits. Once visits arrive the badge reads Collecting. If you turn collection off again, the badge goes back to Collection off and the page keeps showing what was recorded earlier.
Only your published public shop collects, after the visitor allows it. Drafts, previews and workspace pages do not collect. Visitors can refuse without changing shopping, or open Analytics Choices in the footer to withdraw. Global Privacy Control and Do Not Track prevent optional collection. Built-in choices do not authorise external analytics services, which are optional. See Site Design to connect one.
Read the Overview
- Choose Analytics in the menu. It opens on the last 30 days in your shop's time zone, and the line under the title names the period.
- To look at another period, open Change Period, choose From and To, then Apply Dates. Choose up to 90 days.
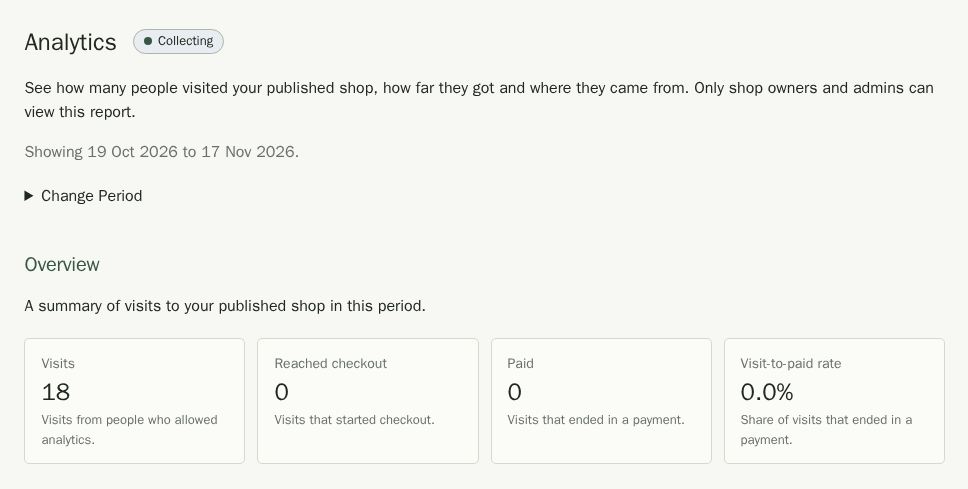
The four tiles are Visits, Reached checkout, Paid and the Visit-to-paid rate, which is the share of visits that ended in a payment. With no visits in the period the rate shows an em dash and says there is not enough data.
Under each section, open How This Is Counted for the details. Analytics counts each day in UTC rather than in your shop's time zone, so a late-evening visit can land on the next day. A payment can link back to the visit that started checkout within 30 days of that visit's start, even after its 30-minute idle window ends.
If a notice says verified payments are still being added, open Change Period and choose Apply Dates again to refresh the report. Sales remains authoritative while analytics catches up.
See How Visits Progressed
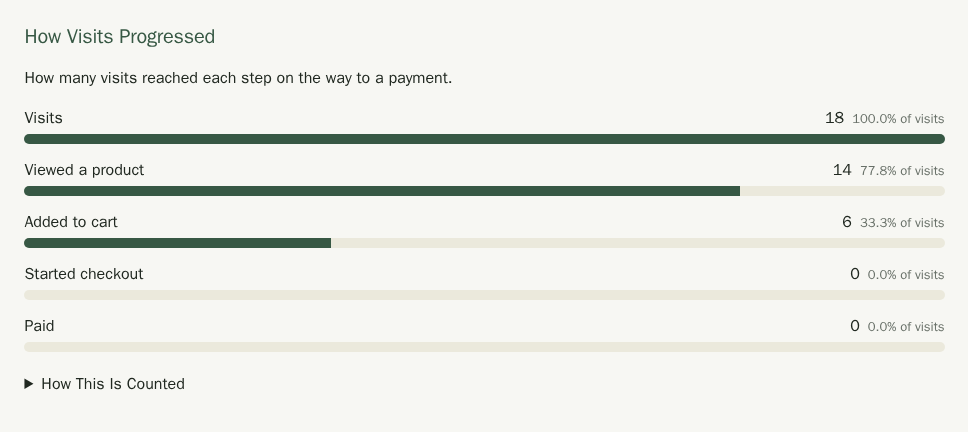
The steps run from Visits to Viewed a product, Added to cart, Started checkout and Paid. Each step counts the visits that also did everything before it, and shows its share of all visits.
What People Looked At
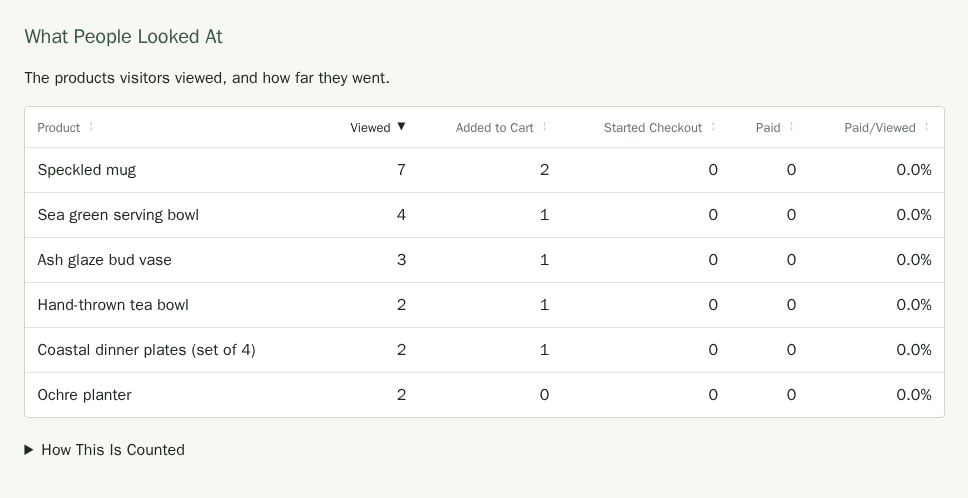
This table lists your most-viewed products, up to 200, with how many visits viewed, added to cart, started checkout for and paid for each one. Variants count towards their parent product. Choose a column heading to sort; on a phone, use the Sort by menu. Paid/Viewed divides a product's paid visits by its viewed visits, and shows an em dash when nobody viewed it.
Where Visits Came From
Sources are Search, Social, Email, Referral and Unknown. They are approximate labels, not proof of a person, campaign or referring business. Unknown includes direct, unconsented and blocked visits, and payments with no available attribution.
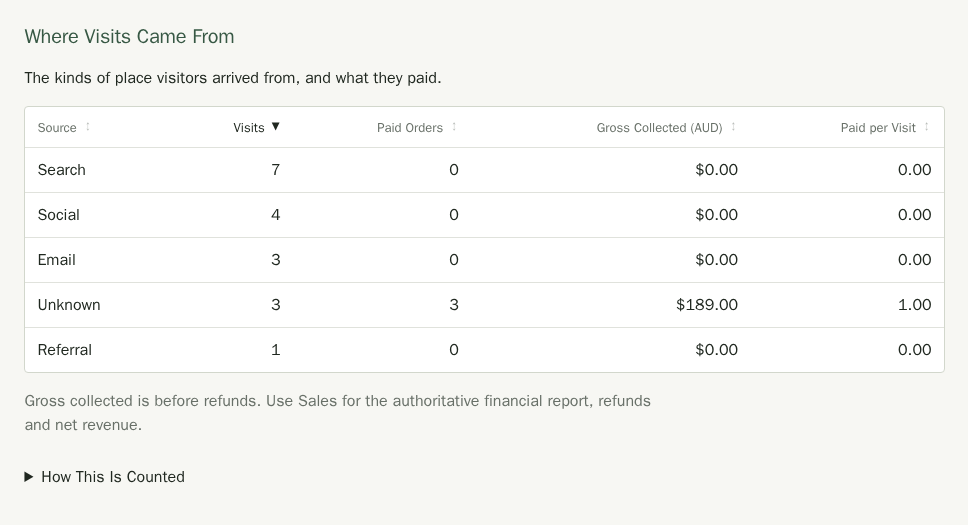
Paid Orders and Gross Collected (in your shop's currency, such as AUD) count by payment day, including balances collected that day, so they are not the same visits as the funnel. Paid per Visit divides paid orders by visits as a rough guide only, not a conversion rate, and shows an em dash when a source had no visits. Late payments after raw history expires remain Unknown.
Gross collected is before refunds. Use Sales for authoritative money, refunds and net revenue; Sales uses your shop's time zone.
Export Your Analytics
Under Your Analytics Data, choose Download Period Totals for a spreadsheet file of the totals for the selected period, with a line for each source and each product. Most shops need nothing more. For a developer or an analysis tool, open Advanced and choose Download Visit Records: this file holds every visit Stallee still keeps, whatever dates are selected, with visit and order references, times and fixed labels. It does not include customer names or contact details.
Stallee keeps the record of each visit for at most 30 days from when the visit started. Daily totals, which identify no one, are kept for 13 calendar months. The browser choice expires after 30 days; the host-only analytics session expires after 30 minutes without activity. Withdrawing removes available records and contributions for the current session. Earlier expired sessions cannot be identified from the saved choice.
Delete Analytics Permanently
- Untick Built-in storefront analytics in Site Design, save and publish to stop collection.
- Return to Analytics and choose Email Deletion Approval.
- Open the emailed link and review the confirmation. Choose Delete Analytics Permanently only when ready.
The approval works once and expires after 10 minutes. Deletion cannot be undone. Financial orders and payment records have their own retention and remain available in Sales. Analytics is separate from commerce backups; restoring a backup does not recreate analytics history. Closing a shop also removes its analytics.